 January 7th, 2015
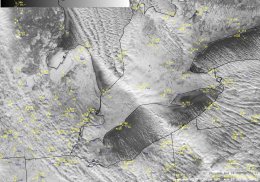
McIDAS images of GOES-13 0.63 µm visible channel data with overlays of surface weather type (above; click image to play animation) showed a large lake effect cloud band that had formed over Lake Huron, moved inland across southern Ontario, and then became further lake-enhanced as it moved over Lake Erie and across northwestern Pennsylvania on . The report of heavy (4-star) snow in far northwestern Pennsylvania was at Meadville — it reduced surface visibility there to 1.25 miles at times, and produced at least 6 inches of snowfall at that location. To the north of Meadville, 8.5 inches of snow were reported at Edinboro.
 AWIPS images of Suomi NPP VIIRS 0.64 µm visible channel data are shown with overlays of surface METARs, RTMA winds, and frontal boundaries at 17:39 UTC (above) and 19:19 UTC (below). The RTMA surface winds showed that there was low-level convergence in the vicinity of the weakening cold frontal boundary/surface trough that was sagging southward and southwestward across the region (animation) — this convergence may have helped to maintain the cloud band as it continued to move southeastward across Lake Erie during the afternoon hours. Meadeville PA is station identifier KGKJ.
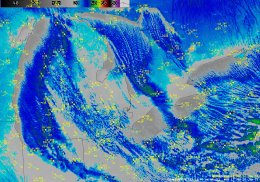
Suomi NPP VIIRS 11.45 µm IR channel images (below) showed that the coldest cloud-top IR brightness temperatures over both the Ontario and Pennsylvania portions of the band were -36º C (lighter green color enhancement) — at London, Ontario (CYXU), embedded towering cumulus (coded TCU EMBD) were reported at both 18 UTC and 19 UTC.
The Terra MODIS Sea Surface Temperature product around 18:11 UTC (below) showed that Lake Erie water temperatures were still as warm as the middle 30s F (blue) on either side of the blacked-out lake effect/lake enhanced cloud band — so moving an arctic air mass with 850 hPa temperatures colder than -20º C or -4º F over that water yielded a sufficient “delta-T” value to promote further enhancement/growth of the snow-producing cloud band which originated over Lake Huron.
YOU MIGHT ALSO LIKE


